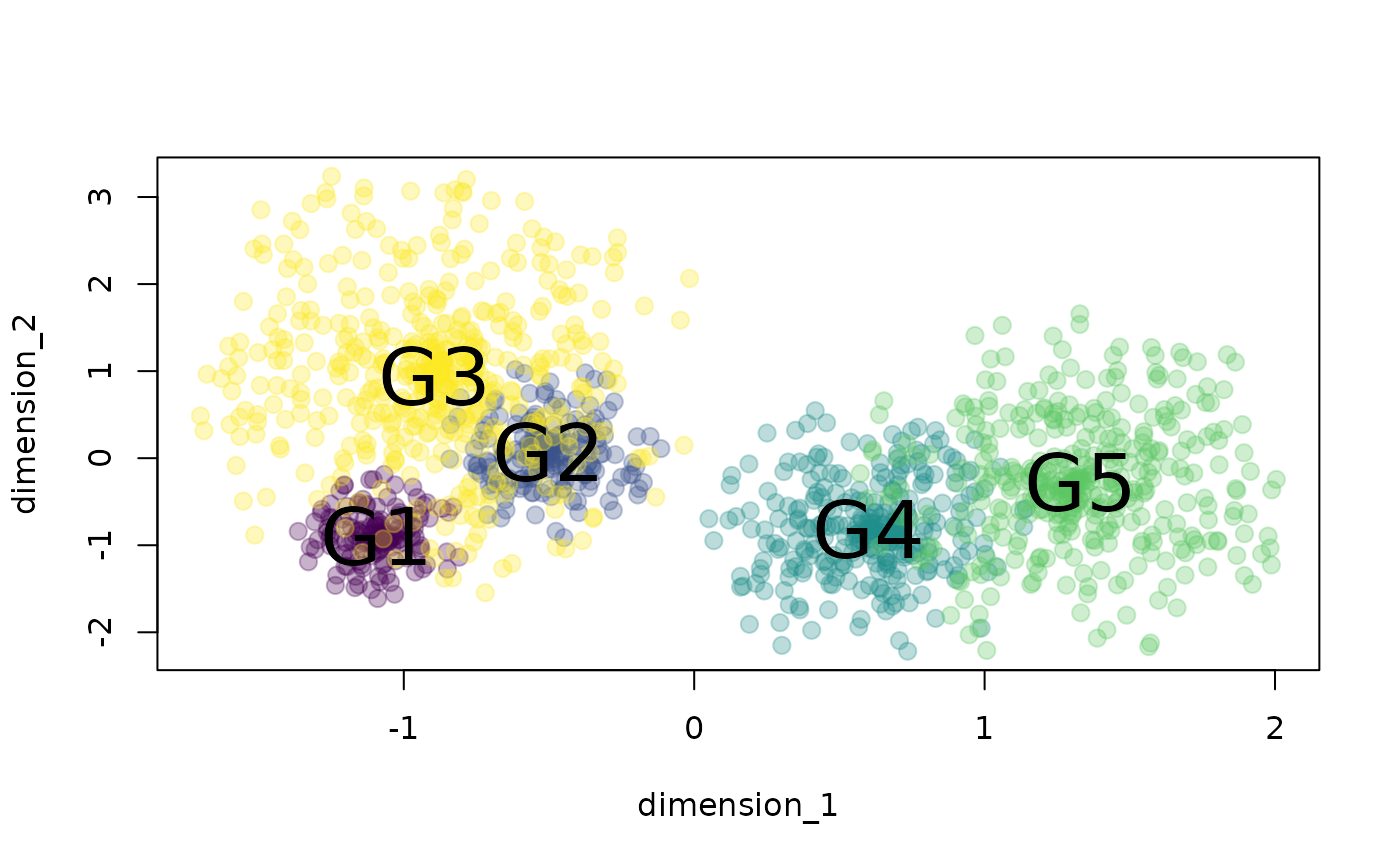
example_space is a data frame with 1550 observations of a simulated phenotypic tri-dimensional space including 5 groups.
Usage
data(example_space)Examples
{
# load data
data("example_space")
#plot space in 2 dimensions
xs <- tapply(example_space$dimension_1, example_space$group, mean)
ys <- tapply(example_space$dimension_2, example_space$group, mean)
plot(example_space[, c("dimension_1", "dimension_2")],
col = example_space$color, pch = 20, cex = 1.8)
text(xs, ys, labels = names(xs), cex = 2.5)
# Install and load necessary libraries
rlang::check_installed("plotly")
library(plotly)
# plot space in 4 dimensions
plot_ly(
data = example_space,
x = ~dimension_1,
y = ~dimension_2,
z = ~dimension_3,
type = "scatter3d",
mode = "markers",
alpha = 0.8,
marker = list(size = 4),
color = ~ group,
colors = unique(example_space$color)
)
}
 #> Loading required package: ggplot2
#>
#> Attaching package: ‘plotly’
#> The following object is masked from ‘package:ggplot2’:
#>
#> last_plot
#> The following object is masked from ‘package:stats’:
#>
#> filter
#> The following object is masked from ‘package:graphics’:
#>
#> layout