I got the following question about cross-correlation:
“We would like to compare every call within a selection table to a template of each owl, and get peak correlation coefficients on each call separately”
One way to do this would be putting the unidentified and template signals together into a single selection table, and then running cross-correlation. However, this will also compare all unidentified signals against each other, which can be very inefficient. A better way would be running a loop that compares each row in a selection table to the set of template songs and then put the results back into the selection table. This post shows how to do exactly that.
First set up the example data and global options:
# load warbleR
library(warbleR)

#load data and save sound files
data("Phae.long.est")

# set warbleR global options
# this options can also be set within the function call
warbleR_options(wl = 300, pb = FALSE, ovlp = 90, flim = c(1, 12),
                pal = reverse.heat.colors)
We’ll use the example data set from the NatureSounds package. This data has long-billed hermit songs from different song types (see ’lek.song.type’ column). Check out the full description of the data here.
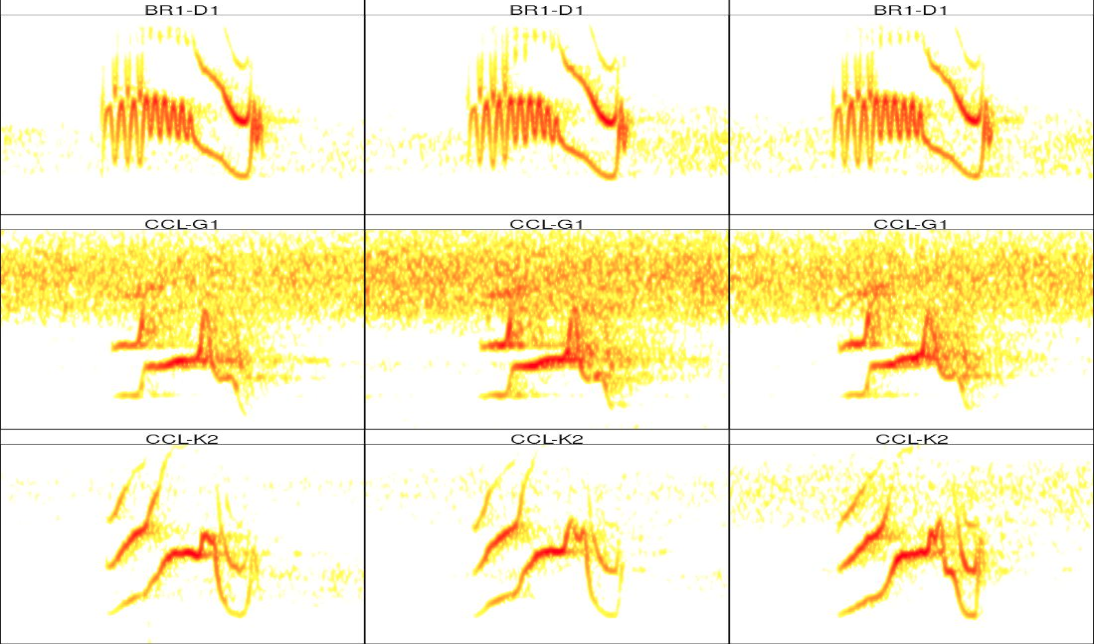
The first step is to create an example selection table for unidentified songs (or calls if working with owl vocalizations) and another one for the template songs. In the following code we get 3 examples for each song type in the (extended) selection table (unk.songs) and 1 of each song type in a template set (tempts):
# get songs to identify
unk.songs <- Phae.long.est[c(1:3, 11:13, 21:23), ]

# get 3 template songs to compare against
tempts <- Phae.long.est[c(10, 20, 30), ]
We can look at the spectrograms for the 2 sets as follows:
# catalog for unk.songs
catalog(unk.songs, nrow = 3, ncol = 3, rm.axes = T, width = 11,
        labels = "lek.song.type")

# catalog for templates
catalog(tempts, nrow = 2, ncol = 3, rm.axes = T, width = 11,
        labels = "lek.song.type")

As you can see the templates have a single example of each of the 3 song types in the ‘unk.songs’ selection table.
Now we have to create a routine that will compare each row in the ‘unk.songs’ selection table to each template and put the results in a data frame:
# loop for each row
out <- lapply(1:nrow(unk.songs), function(x) {

  # extract each row at the time
  X <- unk.songs[x, , drop = FALSE]

  # bind the unk.songs and the templates in a single extended selection table
  Y <- rbind(X, tempts)

  # run cross correlation
  xc <- xcorr(Y, pb = FALSE)

  # put results into a data frame
  Z <- data.frame(X, t(round(xc[ -1, 1], 3)))

  # rename columns with xc values
  names(Z)[9:11] <- tempts$lek.song.type

  return(Z)
  })

# put results back into a single data frame
xcorr_results <-  do.call(rbind, out)
Let’s take a look at the output (excluding irrelevant columns):
xcorr_results[ , -c(3:6)]
The last 3 columns show the cross-correlation scores for each of the 3 templates, respectively. Note that the highest scores correspond to the templates belonging to the same song type category (highllighted cells).
The code can go faster by using parallel computing. This can be done using the pblapply function (instead of lapply) from the pbapply package setting the argument cl.
Hope that helps!
Session information
## R version 3.5.1 (2018-07-02)
## Platform: x86_64-pc-linux-gnu (64-bit)
## Running under: Ubuntu 18.10
##
## Matrix products: default
## BLAS: /usr/lib/x86_64-linux-gnu/openblas/libblas.so.3
## LAPACK: /usr/lib/x86_64-linux-gnu/libopenblasp-r0.3.3.so
##
## locale:
##  [1] LC_CTYPE=en_US.UTF-8       LC_NUMERIC=C
##  [3] LC_TIME=en_US.UTF-8        LC_COLLATE=en_US.UTF-8
##  [5] LC_MONETARY=en_US.UTF-8    LC_MESSAGES=en_US.UTF-8
##  [7] LC_PAPER=en_US.UTF-8       LC_NAME=C
##  [9] LC_ADDRESS=C               LC_TELEPHONE=C
## [11] LC_MEASUREMENT=en_US.UTF-8 LC_IDENTIFICATION=C
##
## attached base packages:
## [1] stats     graphics  grDevices utils     datasets  methods   base
##
## other attached packages:
## [1] warbleR_1.1.16     NatureSounds_1.0.1 seewave_2.1.0
## [4] tuneR_1.3.3        maps_3.3.0         kableExtra_0.9.0
##
## loaded via a namespace (and not attached):
##  [1] Rcpp_1.0.0        pracma_2.2.2      bindr_0.1.1
##  [4] highr_0.7         compiler_3.5.1    pillar_1.3.0
##  [7] bitops_1.0-6      iterators_1.0.10  tools_3.5.1
## [10] Sim.DiffProc_4.3  digest_0.6.18     viridisLite_0.3.0
## [13] evaluate_0.12     tibble_1.4.2      fftw_1.0-4
## [16] pkgconfig_2.0.2   rlang_0.3.1       rstudioapi_0.9.0
## [19] yaml_2.2.0        parallel_3.5.1    bindrcpp_0.2.2
## [22] dplyr_0.7.6       xml2_1.2.0        httr_1.4.0
## [25] stringr_1.3.1     knitr_1.20        hms_0.4.2
## [28] tidyselect_0.2.4  rprojroot_1.3-2   glue_1.3.0
## [31] R6_2.3.0          dtw_1.20-1        jpeg_0.1-8
## [34] pbapply_1.3-4     rmarkdown_1.10    soundgen_1.3.2
## [37] purrr_0.2.5       readr_1.3.1       magrittr_1.5
## [40] scales_1.0.0      backports_1.1.3   htmltools_0.3.6
## [43] MASS_7.3-50       assertthat_0.2.0  rvest_0.3.2
## [46] colorspace_1.3-2  Deriv_3.8.5       stringi_1.2.4
## [49] proxy_0.4-22      munsell_0.5.0     signal_0.7-6
## [52] RCurl_1.95-4.11   crayon_1.3.4      rjson_0.2.20